Objective
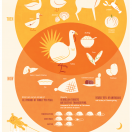
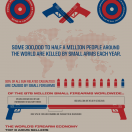
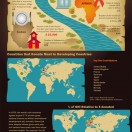
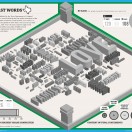
An infographic is meant to present information – statistical, chronological, or other data – in such a way as to engage the
viewer and to provide a more interesting method of relaying information than a list of facts and figures. The design needn’t necessarily be a series of exact graphs and diagrams; it does, however, need to compel the viewer to continue reading. Infographics typically relay a large amount of information, so you must keep the attention of the viewer long enough to impart your message.
The focus of your piece should be the information you’re presenting. The graphic elements that you will create (other than backgrounds, bars, etc) are there to display that information, not to simply adorn it. If you can do both at once, that’s a plus.
Objective
You are to create a graphic version of your idea of the ideal day. This should be specific to you but include information in a way that others viewing the infographic could relate to. It’s likely that this would include a chronological account of the day with particular things happening, but it doesn’t have to specifically do that.
The approach you choose to take is your decision; you may create a wide-ranging piece covering a vast array of information, or you may choose to zero in on a very specific approach. For example, your day might include all the things you might want to do in your life that can feasibly fit within one day. Or, it could just represent a typical good day.
Some examples of approaches include:
- A chronological account of your ideal sequences of events (with coinciding imagery for each of these examples)
- A geographical/map guide to where you would go, and the path you’d take
- A more loose approach that doesn’t necessarily present a chronology, but just various things that would be good components of an ideal day
Project Specs
- At least 10″ x 15″ (May be vertical or horizontal)
- CMYK, Any Paper
- Physical and Digital Submission
Project Focus
- Good balance of graphic and textual presentation of information
- Strong typographical hierarchy
- Content that is textually rich but not unappealing
Project Requirements
- At least 10 items (places, suggestions, sources of entertainment, nuggets of enlightenment)
- At least 1 graphic representation of information (like a bar graph or pie chart), but probably more
- A roughly equal balance of imagery and type content. If your type is treated as graphic information, then the balance will wing a bit of course
No photography is allowed. Illustration should be original (you should be able to show some sketching/inspiration/research material). Items that would simply be busy work to draw (The contour of the US, for example) may be obtained via the web, but this must be approved.
Instructions
Step 1
Begin researching the concept and style of your piece. You should explore several approaches (at least 3, with sketching for each) so you’re sure to have a concept for which you can compile and create enough material. Discuss with instructor for guidance and approval of your general concept by the class after assignment. There isn’t an exact amount of information that is required; this will differ based upon your approach, which is why you must discuss what you’re planning and ensure there’s enough information present to fulfill the project. Your sketches/ideas are due the class after assignment.
Step 2
Begin gathering materials and content for your graphic. You should not be creating graphics yet until you have gathered at least the majority of your content and therefore know what your design is going to represent.
Step 3
Begin creating your working file in Illustrator, continuing to seek and take feedback from peers and instructor as you work on your project to completion.
Submission
Place your working file(s) and a full-size pdf proof with no bleed in a folder labeled [lastname_first-initial_project2] and place it in the drop box by the beginning of class on critique day. Have your full-size printed piece ready at the beginning of class as well.
- Folder with working files, PDF proof
- Full-size physical submission
Resources
- good.is : Tons of infographics
- http://visual.ly : Even More Infographics
- Two Point Perspective Demo : Scroll down
